Testing and debugging are crucial steps in the web development process. They help identify and fix issues, ensure code quality, and deliver a reliable and functional web application.
Let’s dive into testing and debugging practices commonly used in web development:
Unit Testing
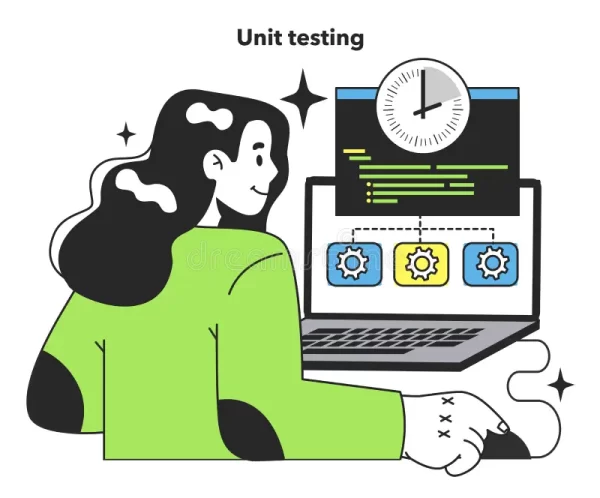
Unit testing is a software testing technique that focuses on testing individual units or components of code in isolation. The purpose of unit testing is to verify that each unit of code performs as expected and produces the desired output.
Here are some key aspects of unit testing:
Isolation: Unit tests should be written in a way that isolates the unit under test from its dependencies. This is typically achieved by using test doubles such as mock objects or stubs to simulate the behavior of external dependencies. Isolating the unit being tested ensures that any failures or issues are specific to that unit and not caused by interactions with other components.
Automation: Unit tests should be automated, meaning they can be executed repeatedly and reliably. Automation allows you to run tests frequently, especially during development or when changes are made, to quickly catch any regressions or defects.
Test Frameworks: Use a unit testing framework specific to your programming language or framework. For example, popular frameworks include Jest (JavaScript), pytest (Python), JUnit (Java), and NUnit (.NET).
These frameworks provide a structured way to write and run unit tests and offer various assertion methods to validate expected results.
Arrange, Act, Assert (AAA) Pattern: The AAA pattern is a common structure for organizing unit tests. The pattern consists of three steps:
- Arrange: Set up the necessary preconditions and inputs for the test.
- Act: Invoke the unit being tested with the provided inputs.
- Assert: Verify that the actual output matches the expected output or behavior.
Test Coverage: Aim for high test coverage, which measures the percentage of code exercised by unit tests. While 100% coverage may not always be practical or necessary, it helps ensure that most critical paths and logic branches are thoroughly tested. Coverage analysis tools can provide insights into the extent of test coverage.
Test-Driven Development (TDD): TDD is a development approach where unit tests are written before the corresponding code. Following TDD helps drive the design and implementation of code based on desired functionality. Initially, the test will fail, and then the code is written to make the test pass.
Continuous Integration (CI): Incorporate unit tests into your CI pipeline. Whenever code changes are committed to version control, CI systems automatically build the application and run the unit tests. This ensures that new changes do not break existing functionality and allows for early detection of issues.
Integration Testing
Integration testing is a software testing technique that focuses on testing the interactions between different components or modules of an application. It aims to verify that these components work together correctly, communicate effectively, and produce the expected results.
Here are some key aspects of integration testing:
Scope and Approach: Integration testing can be performed at different levels, such as module-level, subsystem level, or system-level. Determine the scope of integration testing based on the complexity of your application and the interactions between its components. You can adopt either a top-down or bottom-up approach to integration testing.
- Top-down: Start with testing higher-level components and gradually integrate lower-level components. Stub or mock the dependencies of lower-level components during testing.
- Bottom-up: Begin with testing lower-level components and progressively integrate higher-level components. Use drivers or test harnesses to simulate the behavior of higher-level components.
Identify Dependencies: Identify the dependencies between the components you are testing. This includes understanding the data flow, communication protocols, APIs, or interfaces used for interaction. By understanding these dependencies, you can design test cases that cover different integration scenarios.
Data Preparation: Ensure that the test environment is properly set up with appropriate test data. This may involve creating test databases, configuring mock services, or preparing input data for the integration tests. The test data should represent different scenarios and edge cases to validate the behavior of the integrated components.
Integration Test Cases: Design integration test cases that exercise the interactions between the components. Test cases should cover various scenarios, including normal flows, error handling, and boundary conditions. Focus on the inputs, outputs, and side effects of the interactions between components.
Stubbing and Mocking: To isolate the components being tested and control the behavior of their dependencies, use stubs or mock objects. Stubs provide predefined responses to simulate the behavior of dependencies, while mock objects allow you to verify that specific interactions occur as expected. Frameworks like Mockito (Java), Sinon.js (JavaScript), or Moq (.NET) can assist in creating stubs and mocks.
Integration Test Execution: Run the integration tests in an environment that closely resembles the production environment. This ensures that the tests reflect real-world conditions and interactions. Automate the execution of integration tests so that they can be easily repeated and incorporated into a continuous integration (CI) or continuous delivery (CD) pipeline.
Logging and Debugging: Incorporate logging and debugging mechanisms in your application to capture relevant information during integration testing. Detailed logs and error messages aid in diagnosing and resolving issues that may arise during integration testing.
Test Oracles: Determine the expected outcomes of the integration tests. This may involve comparing the actual output or behavior against predefined expectations. Define test oracles, which are rules or criteria used to determine the correctness of the integrated system’s behavior.
Continuous Integration and Deployment: Integration tests should be included in your CI/CD pipeline. Whenever changes are made to the codebase, the integration tests should be automatically triggered to catch any regressions or integration issues.
Functional Testing
Functional testing is a software testing technique that focuses on testing the functional requirements of an application. It ensures that the application behaves correctly and delivers the intended functionality to users. Functional testing is performed from the user’s perspective and validates the application against its functional specifications.
Here are some key aspects of functional testing:
Test Scenarios and Use Cases: Identify and define test scenarios and use cases that cover the various functionalities and features of the application. These scenarios should represent typical user interactions, cover different workflows, and include both positive and negative test cases. Test scenarios should be derived from functional requirements and user stories.
User Interface (UI) Testing: Test the user interface of the application to ensure that it is intuitive, responsive, and aligned with the design and usability guidelines. Validate that buttons, links, forms, menus, and other UI elements function correctly and provide the expected behavior. Consider aspects such as layout, navigation, input validation, and error handling.
Data Validation: Validate the input data and verify that the application handles different types of data correctly. This includes testing boundary values, data formats, data constraints, and error conditions. Ensure that the application correctly processes and displays both valid and invalid data.
Functional Flows: Test the end-to-end functional flows of the application. This involves simulating user interactions and validating that the application behaves as expected throughout the entire flow. For example, testing a registration process, shopping cart functionality, or a multi-step form submission.
Business Logic Testing: Verify that the application’s business logic is implemented correctly. This includes testing calculations, algorithms, rules, workflows, and any specific business requirements. Test different scenarios that exercise the business logic to ensure that it produces the expected outcomes.
Integration Testing: While integration testing was discussed earlier, it is worth mentioning that integration testing also plays a part in functional testing. Verify that the integration between different modules or components of the application functions correctly and that data is exchanged accurately.
Data Manipulation and Persistence: If the application interacts with a database or manipulates data, test the data manipulation and persistence functions. This includes testing data retrieval, storage, updating, and deletion operations. Validate that data is correctly stored, retrieved, and modified based on the application’s functionality.
Error Handling: Test how the application handles errors and exceptions. Validate that appropriate error messages are displayed to users, error conditions are properly logged, and the application gracefully recovers from errors without crashing or compromising security.
Usability Testing: While not strictly functional testing, usability testing assesses the application’s user-friendliness and ease of use. It involves testing aspects such as intuitiveness, navigation, responsiveness, and overall user experience. Usability testing can help identify potential areas for improvement in terms of user interface and interaction design.
Regression Testing: As new features or changes are introduced, perform regression testing to ensure that existing functionality is not affected. Revisit and retest previously functional areas to verify that they continue to work as expected.
Performance Testing
Performance testing is a software testing technique that focuses on evaluating the performance and responsiveness of an application under various workload conditions. It aims to assess the application’s speed, scalability, stability, and resource usage. Performance testing helps identify bottlenecks, measure response times, and determine the application’s ability to handle anticipated user loads.
Here are some key aspects of performance testing:
Types of Performance Testing:
- There are different types of performance testing that serve specific purposes:
- Load Testing: Determines how the application performs under normal and peak load conditions by simulating a high number of concurrent users or transactions.
- Stress Testing: Tests the application’s limits and evaluates its performance under extreme or beyond-normal workload conditions to identify breaking points or failure scenarios.
- Volume Testing: Tests the application’s performance when dealing with a large volume of data, such as database size, file storage, or network traffic.
- Endurance Testing: Evaluate the application’s performance over an extended period to identify any performance degradation, memory leaks, or resource utilization issues.
- Scalability Testing: Measures the application’s ability to handle increasing workload demands by adding more resources or scaling horizontally.
Performance Metrics: Define relevant performance metrics to measure and analyze during testing.
- Common performance metrics include:
- Response Time: The time taken by the application to respond to a user request.
- Throughput: The number of requests or transactions the application can handle per unit of time.
- Concurrency: The number of concurrent users or connections the application can support.
- CPU and Memory Usage: Measure the application’s resource consumption during testing.
- Error Rate: The percentage of failed requests or errors encountered during testing.
Test Environment Setup: Create a test environment that closely resembles the production environment. This includes setting up the necessary hardware, software, databases, networks, and configurations. Use realistic test data and simulate various user scenarios to ensure accurate performance testing results.
Performance Test Tools: Utilize specialized performance testing tools to conduct performance tests effectively.
Some popular performance testing tools include:
- Apache JMeter: A widely-used open-source tool for load and performance testing that can simulate various user scenarios and generate performance reports.
- Gatling: Another open-source tool for load and performance testing that is known for its scalability and high-performance scripting capabilities.
- LoadRunner: A commercial tool that provides a comprehensive set of features for load, stress, and performance testing.
- Locust: An open-source tool that allows you to write performance tests in Python, making it highly flexible and extensible.
Test Scenarios and Workloads: Define realistic test scenarios and workloads that mimic real-world usage patterns. Consider different user profiles, varying transaction volumes, and usage patterns to simulate a variety of scenarios. Design tests to represent both normal and peak load conditions to understand application performance under different circumstances.
Performance Test Execution and Monitoring: Execute performance tests by simulating the defined workloads and scenarios. Monitor and measure the performance metrics during test execution. Collect and analyze data such as response times, CPU and memory usage, throughput, and error rates. Identify any performance bottlenecks, degradation, or unexpected behaviors.
Performance Tuning and Optimization: Identify performance bottlenecks and areas for improvement. Analyze the test results to pinpoint potential performance issues in the application code, database queries, network latency, or resource utilization. Optimize the application by implementing performance improvements and retesting to validate the effectiveness of the optimizations.
Capacity Planning: Use the results from performance testing to assist in capacity planning. Understand the application’s performance characteristics, scalability, and resource requirements to make informed decisions about infrastructure scaling or provisioning.
Real-World Simulation: Whenever possible, perform performance testing using real-world network conditions and hardware configurations. Simulate network latency, bandwidth restrictions, or specific hardware configurations to understand how the application performs in diverse environments.
Continuous Performance Testing: Incorporate performance testing as an ongoing activity in the software development lifecycle. Integrate performance testing into your continuous integration and deployment pipelines to catch performance regressions early on and ensure that new features do not introduce performance issues.
Cross-browser Testing
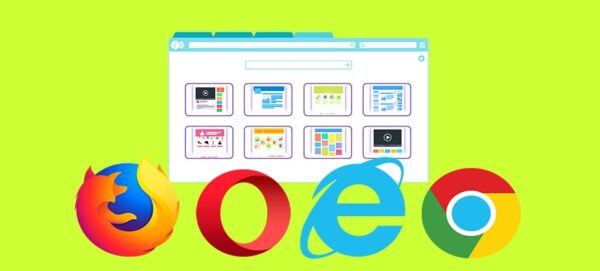
Cross-browser testing is a software testing technique used to ensure that a web application or website functions correctly and appears consistently across different web browsers and browser versions. Since different browsers have their rendering engines and interpretations of web standards, it’s important to validate the compatibility of your application across multiple browsers.
Here are some key aspects of cross-browser testing:
Browser Coverage: Identify the browsers and versions that are relevant to your target audience. Consider popular browsers like Google Chrome, Mozilla Firefox, Microsoft Edge, Safari, and Internet Explorer. Additionally, consider testing on different versions of these browsers, as older versions may have different behavior or lack support for newer web technologies.
Responsive Design: Verify that your web application or website is responsive and adapts correctly to different screen sizes and resolutions. Test how the layout, content, and user interface elements adjust and function across various devices, including desktops, tablets, and mobile devices.
CSS and Styling: Ensure that the CSS styles are rendered consistently across browsers. Test different styling elements such as fonts, colors, borders, backgrounds, and layout properties. Pay attention to browser-specific quirks or inconsistencies in the rendering of CSS styles.
HTML and Markup: Validate that the HTML structure and markup of your web pages are interpreted correctly by different browsers. Verify the compatibility of HTML elements, tags, attributes, and their behavior across various browsers.
JavaScript Compatibility: Test the JavaScript functionality of your application on different browsers. JavaScript behavior can vary across browsers due to differences in JavaScript engines and support for specific features. Test common JavaScript interactions, event handling, AJAX requests, and browser-specific JavaScript APIs.
Form Validation and Functionality: Test the validation and functionality of HTML forms, including input fields, dropdowns, checkboxes, radio buttons, and form submissions. Validate that form validation, data submission, and processing work as expected across different browsers.
Media and Plugins: If your application includes media elements like images, audio, and video, or uses plugins like Flash or Java applets, ensure they are rendered correctly and function as intended across various browsers. Some browsers may have limitations or require specific plugins for certain media formats or features.
Browser DevTools: Utilize browser developer tools, such as Chrome DevTools, Firefox Developer Tools, or Safari Web Inspector, to inspect and debug your application across different browsers. These tools allow you to examine the DOM, inspect network requests, debug JavaScript code, and simulate various device and network conditions.
Cloud-Based Testing Platforms: Consider using cloud-based cross-browser testing platforms like BrowserStack, Sauce Labs, or CrossBrowserTesting. These platforms provide virtual environments where you can test your application on different browsers, operating systems, and devices without the need for setting up multiple physical devices or virtual machines.
Automated Testing: Use automation tools and frameworks like Selenium, Cypress, or TestCafe to automate cross-browser testing. Automation can help streamline the testing process, ensure consistent test coverage across browsers, and save time when performing repeated tests.
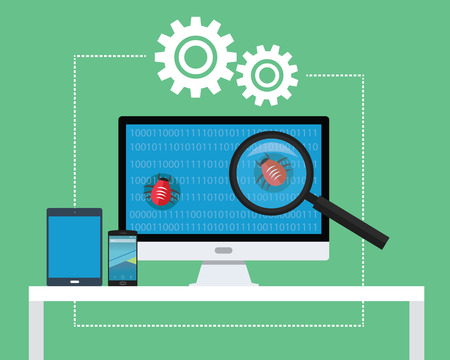
Debugging Tools

Debugging tools are software utilities that assist developers in identifying and fixing errors, bugs, and issues in their code. These tools provide insights into the execution of the code, help analyze variables, track program flow, and facilitate troubleshooting.
Here are some commonly used debugging tools:
Integrated Development Environments (IDEs): Many IDEs provide built-in debugging capabilities, including features such as breakpoints, step-through execution, variable inspection, call stack navigation, and error highlighting. Examples of popular IDEs with robust debugging tools include Visual Studio, IntelliJ IDEA, Eclipse, and Xcode.
Debugging Consoles: Programming languages and environments often offer debugging consoles or REPL (Read-Eval-Print Loop) interfaces. These interactive consoles allow developers to execute code snippets, inspect variables, and test code in an isolated environment. Examples include the JavaScript console in web browsers or the Python interpreter.
Logging: Logging libraries or frameworks, such as log4j for Java or logging in Python’s standard library, allow developers to insert logging statements at various points in the code. Log messages can provide valuable information about the program’s execution, variable values, and specific actions taken, helping to identify and trace issues.
Debugging Libraries and Extensions: Many programming languages and frameworks have specific debugging libraries or extensions that provide additional tools and capabilities. For example, the Python pdb library allows for interactive debugging, while JavaScript frameworks like React have browser extensions that aid in debugging React components.
Browser Developer Tools: Web browsers provide built-in developer tools, such as Chrome DevTools, Firefox Developer Tools, or Safari Web Inspector. These tools offer a range of debugging features for web development, including live DOM inspection, network monitoring, JavaScript debugging, performance profiling, and console output analysis.
Profiler Tools: Profiling tools help analyze the performance and resource usage of an application. They provide insights into CPU utilization, memory usage, and execution times of specific code sections. Examples include VisualVM for Java, Xdebug for PHP, and Chrome DevTools’ performance profiler for JavaScript.
Remote Debugging: Remote debugging tools allow developers to debug code running on remote machines, virtual machines, or remote devices. This is particularly useful when troubleshooting issues that occur in production environments or on different devices. Tools like Remote Debugging in Chrome or Visual Studio Remote Debugging enable remote debugging capabilities.
Error Tracking and Monitoring Tools: Error tracking tools, such as Sentry, Rollbar, or Bugsnag, capture and log errors that occur in production or during testing. These tools provide detailed error reports, stack traces, and context information, helping developers identify and resolve issues efficiently.
Code Profilers: Code profiling tools analyze the runtime behavior of code and identify performance bottlenecks. They provide insights into function call times, memory usage, and resource consumption. Profilers like Java VisualVM, Python’s cProfile, or. NET’s Performance Profiler can assist in optimizing code performance.
Unit Testing Frameworks: While primarily used for testing, unit testing frameworks like Jest (JavaScript), JUnit (Java), or pytest (Python) often include debugging capabilities. These frameworks allow developers to execute tests in a debugging mode, set breakpoints within test code, and step through test execution.
Error Logging and Monitoring
Error logging and monitoring are essential practices in software development for capturing, tracking, and analyzing errors and exceptions that occur in an application. They help developers identify and resolve issues, improve system stability, and enhance the overall user experience.
Here are some key aspects of error logging and monitoring:
Logging Libraries and Frameworks: Utilize logging libraries or frameworks specific to your programming language or framework. These libraries provide methods or APIs to log error messages, stack traces, timestamps, and additional contextual information. Examples include log4j/log back for Java, logging in Python’s standard library, or Winston for Node.js.
Error Severity Levels: Define and categorize error severity levels, such as “debug,” “info,” “warning,” “error,” or “critical.” Assigning appropriate severity levels to logged errors helps prioritize and triage issues during troubleshooting and maintenance.
Error Messages and Context: Log informative and descriptive error messages that provide relevant details about the error, including error codes, request parameters, environment information, and user context. These details facilitate better understanding and diagnosis of errors when reviewing logs.
Stack Traces: Include stack traces in error logs to capture the sequence of method or function calls leading up to the error. Stack traces help identify the exact location and cause of an error, making debugging more efficient.
Centralized Log Management: Centralize error logs in a dedicated log management system or service. This allows for easy aggregation, search, analysis, and correlation of logs across multiple instances or components of an application. Popular log management tools include ELK Stack (Elasticsearch, Logstash, Kibana), Splunk, or Graylog.
Real-Time Alerting: Implement real-time alerting mechanisms to receive notifications when critical errors or exceptions occur. These alerts can be sent via email, instant messaging platforms, or integrated with incident management systems like PagerDuty or Opsgenie. Real-time alerts ensure prompt attention to critical issues and enable quick response and resolution.
Error Tracking and Analytics: Integrate error tracking and analytics tools into your application to gain insights into error patterns, trends, and occurrences. These tools capture and analyze error logs, providing valuable information such as error frequencies, affected user segments, or the most common error scenarios. Examples include Sentry, Rollbar, or New Relic Error Analytics.
Automatic Error Reporting: Automatically capture and report errors that occur in production environments. This can be achieved by implementing global error handlers or exception filters that intercept unhandled exceptions, log relevant details, and notify developers or system administrators.
Versioning and Contextual Data: Include version information of the application, libraries, or dependencies in error logs. Additionally, log contextual data such as user sessions, HTTP headers, or API request/response payloads to assist in reproducing and diagnosing errors accurately.
Periodic Log Review: Regularly review error logs to identify recurring patterns, high-impact issues, or performance-related errors. Periodic log analysis helps detect potential issues, monitor error trends, and take proactive measures to address them.
Discover more from Wits Technologies Ltd
Subscribe to get the latest posts sent to your email.
- Checklist: Monthly Website Maintenance for Peak Performance

- LinkedIn Ads vs Instagram Reels: Where Should You Invest in 2025?

- The Death of Cookies; What Digital Marketers Need to Do Now

- How AI is Revolutionizing Automated Web Maintenance

- Fix It Before It Breaks: Preventive Maintenance Strategies for Websites
